
Free calculator · published benchmarks · no fake precision
Music streaming
royalties calculator
2026.
Turn streams into a planning estimate—not a promise. Calculate potential recording royalties from Spotify, Apple Music, Amazon Music and YouTube, compare published cross-platform benchmarks, and work backwards from the income you want to earn.
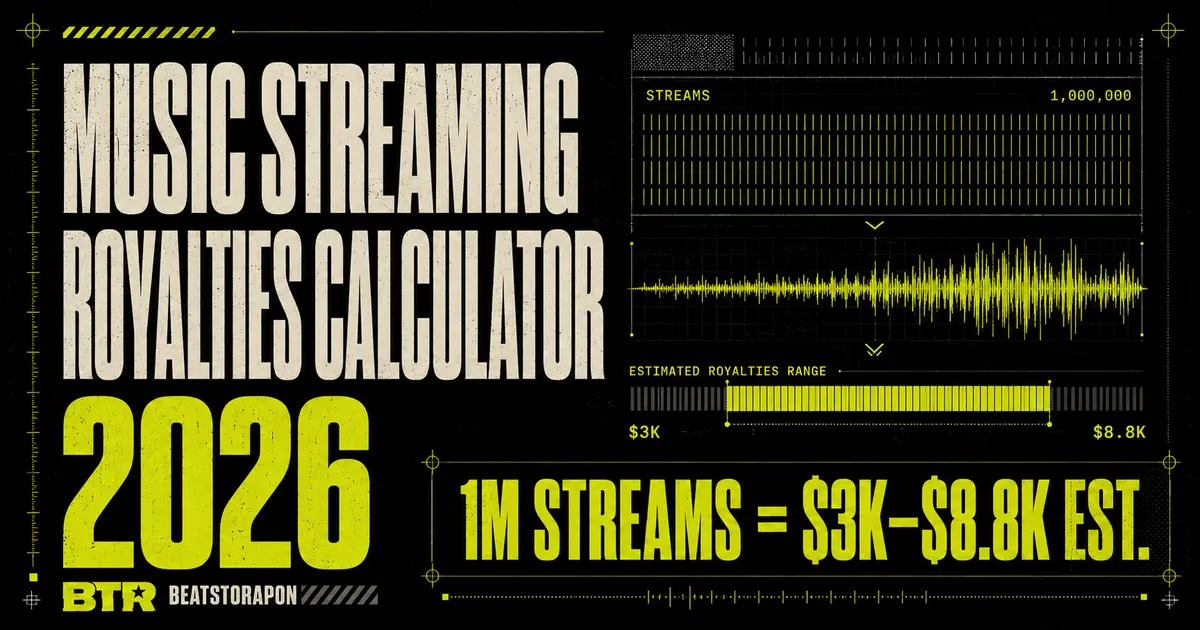
There is no fixed industry-wide “pay per stream” rate. For planning, a comparable independent-rightsholder dataset observed averages from $3.00 to $8.80 per 1,000 streams across four major services.
Observed recording-rights revenue per 1,000 streams across Spotify, YouTube, Apple Music and Amazon Music in Duetti’s 2024 dataset.
Important: these are historical observed averages for planning. Your statement can differ by market, subscription mix, rights ownership, distributor terms and eligibility.
What could your
streams be worth?
Enter eligible streams for each service. The first result estimates gross recording-rights revenue. The second applies your master ownership and distributor, label or service fee.
Streams → estimated money
Default rates use Duetti’s published 2024 observations for independent artists and other master owners. You can edit every rate to match your own statements.
Before your ownership split and percentage fee.
Before recoupment, tax, currency conversion, withdrawal charges or other contract terms.
Streams needed for your target
This reverse estimate uses the ownership percentage and service fee entered above. A dash appears when the effective share is zero.
| Platform | Rate used | Estimated streams needed |
|---|---|---|
| Spotify | $3.00 / 1K | 333,334 |
| Apple Music | $6.20 / 1K | 161,291 |
| Amazon Music | $8.80 / 1K | 113,637 |
| YouTube | $4.80 / 1K | 208,334 |
Calculator scope: a planning estimate for recording/master-side revenue. It does not add composition royalties, enforce platform eligibility rules, model a specific territory or subscription tier, calculate taxes, or replace distributor statements.
One million streams.
Four very different
estimates.
The cleanest cross-platform comparison located for this guide comes from Duetti’s 2024 Music Economics Report, published in January 2025. It analyzed millions of data points associated with independent artists and other master owners.
| Platform | Published observation | 1,000 streams | 10,000 | 100,000 | 1 million |
|---|---|---|---|---|---|
| Spotify | $3.00 / 1KDuetti 2024 master-side dataset | $3 | $30 | $300 | $3,000 |
| YouTube | $4.80 / 1KDuetti 2024 master-side dataset | $4.80 | $48 | $480 | $4,800 |
| Apple Music | $6.20 / 1KDuetti 2024 master-side dataset | $6.20 | $62 | $620 | $6,200 |
| Amazon Music | $8.80 / 1KDuetti 2024 master-side dataset | $8.80 | $88 | $880 | $8,800 |
Source and scope: Duetti’s 2024 Music Economics Report announcement. Multiples are simple arithmetic using the published amount per 1,000 streams. These are observations—not contractual rates or forecasts.
Your royalty statement is the truth.
Why use an older observed dataset in a 2026 guide? Because current platform-wide payout totals and current artist-policy pages do not provide one standardized, independently comparable master-side rate across the same services. Mixing unrelated figures can create a sharper headline while making the comparison less honest.
This article therefore uses the latest comparable cross-platform benchmark located during research, labels its observation year, and lets you replace every default with the effective rate from your own statement. That makes the tool useful without pretending the estimate is a tariff.
No major service
has one fixed
pay-per-stream price.
A music stream is not a miniature download. Most listeners pay for access to a catalogue—or listen through an ad-supported service. The platform then allocates music revenue through royalty pools and rights agreements.
Listener
Pays a subscription or generates advertising revenue.
Platform
Groups eligible revenue by service, territory, plan and accounting period.
Rights pool
Allocates money under licensing terms and the platform’s royalty model.
Rights holder
Label, distributor, publisher or collecting entity receives its side.
Artist
Your agreement, ownership, recoupment and fees determine what reaches you.
Why the effective value changes
- Listener market. Subscription prices and advertising economics differ by country.
- Paid versus free use. Subscription and ad-supported revenue do not produce identical economics.
- Platform revenue mix. Bundles, family plans, promotions and advertising all affect the pool.
- Your share of eligible activity. Streamshare systems allocate pools according to qualified consumption.
- Your rights deal. Labels, distributors, collaborators and recoupment can change the artist’s final amount.
- Recording versus composition. Master and publishing money travel through different routes.
Spotify states this directly in its current Loud & Clear FAQ: listeners do not pay per song, and rights holders are paid through streamshare rather than a fixed per-stream rate. Spotify says roughly two-thirds of its music revenue is paid to music rights holders and reported more than $11 billion in industry payouts for 2025.
That total does not mean Spotify paid $11 billion directly to performers. Platforms normally pay contractual rights holders. What an artist receives depends on who owns the master, who administers the composition and what each agreement deducts along the route.
Same word:
“stream.” Different
economics.
The figures below keep two ideas separate: an observed historical planning benchmark and the platform’s current public explanation of its royalty system.
Duetti 2024 observation
Spotify royalties
Spotify uses streamshare, not a fixed pay-per-play tariff. It says music revenue from subscriptions and advertising is paid to rights holders according to each track’s share of eligible streams within its royalty pools.
Spotify’s current eligibility rule matters for small catalogues: a track needs at least 1,000 streams in the previous 12 months, plus an undisclosed minimum number of unique listeners, to enter the recorded-music royalty pool. The company says the rule applies to recording royalties, not publishing royalties. Read Spotify’s track monetization eligibility guidance.
For a Spotify-specific planning range, deductions and 1,000-to-10-million-stream table, use BTR’s 2026 Spotify royalty calculator.
Duetti 2024 observation
Apple Music royalties
Apple Music’s published royalty note says it pays labels the same 52% headline rate and calculates royalties through streamshare. Apple also reported that its average value was $0.01 per play for individual paid plans in 2020.
That one-cent figure is often repeated as if it were a current artist take-home rate. Apple’s own page is narrower: the figure refers to 2020, varies by plan and territory, and includes both label and publisher royalties. It should not be directly substituted for a current master-only statement. See Apple Music Insights: Royalties.
Duetti 2024 observation
Amazon Music royalties
Amazon Music produced the highest observed amount among the four large services in Duetti’s comparable 2024 dataset. Duetti associated that result with Amazon’s service and subscription mix, including bundling within Prime.
A higher observed average does not automatically mean an artist will earn more total money there. Total revenue also depends on audience size, where those listeners are, the plans they use and whether the artist can generate the same volume of eligible listening on that service.
Duetti 2024 observation
YouTube music royalties
YouTube combines subscription and advertising economics across a wider video-and-music system, so the value of one play can vary substantially. Duetti’s observed 2024 master-side average increased to $4.80 per 1,000 streams, but the report also warned that results varied widely between artists because their revenue mixes differed.
YouTube reported paying more than $8 billion to the music industry during the 12 months from July 2024 through June 2025. It described subscriptions and advertising as its “twin engine” and reported more than 125 million Music and Premium subscribers, including trials. See YouTube’s official payout announcement.
Why some famous
payout numbers are
not comparable.
A complete-looking table can be less accurate than a deliberately incomplete one. BTR did not place Tidal, Deezer, SoundCloud or Qobuz into the default calculator because the public figures and royalty models located were not equivalent to Duetti’s four-platform master-owner dataset.
Qobuz: a verified figure, different scope
Qobuz disclosed an independently audited fiscal-2024 average of $18.73 per 1,000 streams. Its release says that amount represented royalties due to labels and publishers, who then pay artists, songwriters and composers under their contracts. Because it combines recipient groups differently from a master-owner observation, it is not inserted beside Duetti’s master-side figures as if the definitions were identical. Read the Qobuz disclosure and methodology.
SoundCloud: fan-powered royalties
SoundCloud’s fan-powered model connects a participating listener’s subscription or advertising contribution more directly to the eligible artists that person actually hears. That means audience depth and individual fan behaviour matter, making one universal platform rate especially misleading. SoundCloud has expanded the model through licensing partners, including the fan-powered royalty announcements in its newsroom.
Deezer: artist-centric allocation
Deezer’s artist-centric payment system changes how value is allocated rather than publishing one universal price for every play. Its model has included engagement-based treatment, professional-artist criteria and controls intended to reduce manipulation. Deezer and Sacem extended the approach to publishing rights in 2025. See Deezer’s official explanation.
Tidal: use your actual statement
Search results frequently assign Tidal a precise high rate, but this guide did not locate a current official disclosure or directly comparable independent master-owner benchmark that justified placing one fixed Tidal number in the default calculator. If your distributor statement shows an effective rate, enter it by replacing any calculator rate temporarily or use the same formula: streams ÷ 1,000 × dollars per 1,000.
can still produce a smaller cheque.
Do not select a distribution or promotion strategy from the largest number in a comparison table. The financially relevant question is: Where can this specific artist generate qualified listening, repeat fans and follow-on revenue while retaining the rights? A lower observed value per 1,000 can coexist with stronger discovery and a larger total royalty pool.
One stream can feed
more than one right.
The calculator estimates the recording or master side. If you wrote or composed the song, separate publishing royalties may also be generated and routed through different entities.
The sound recording
The master is the specific recorded performance—the finished audio file delivered to a streaming service. Recording royalties usually move from the DSP to a label or distributor and then to the master owner under the relevant agreement.
The composition
The composition covers the underlying lyrics, melody and musical work. Performance and mechanical royalties can flow through publishers, performing-rights organisations, mechanical-licensing entities and administrators.
An independent artist who owns the master and wrote the song may have claims on both sides. A performer who did not write the song may receive only the recording share defined by the deal. A songwriter who does not own the master can still receive composition royalties.
This is why a payout calculator cannot fix missing metadata or undocumented ownership. Before release, record every writer, producer, contributor, percentage and rights identifier. BTR’s producer split sheet guide explains the two copyrights and provides a structure for documenting the deal.
You cannot control
the pool. You can control
the leaks.
The most practical royalty strategy is not chasing a mythical fixed rate. It is protecting eligibility, ownership, metadata, collection and fan value at every stage.
- Own the master where possible. The calculator’s ownership field shows how quickly a split changes take-home revenue.
- Sign split sheets before release. Unresolved ownership can delay registration and payments precisely when a track starts moving.
- Register the composition. A distributor collecting the master side does not necessarily collect every publishing royalty you are owed.
- Audit fees and recoupment. Percentage commissions, annual charges, advances and withdrawal costs are economically different.
- Keep metadata consistent. Artist names, credits, ISRCs, writer identifiers and ownership percentages need to match across the chain.
- Avoid artificial streaming. Invalid activity can be removed, withheld or penalised and can damage future distribution access.
- Track revenue by market and service. Your real effective rate is statement revenue divided by eligible streams for the same period and scope.
- Build direct fan revenue. Streaming is a discovery and recurring-listening layer; superfans, products, tickets and services can raise revenue per fan.
What one direct fan can equal
At the four observed master-side benchmarks used in this guide, $5 of net artist revenue is equivalent to the gross recording value of approximately 1,667 Spotify streams, 1,042 YouTube streams, 807 Apple Music streams or 569 Amazon Music streams. This is not an argument to abandon streaming. It is the reason discovery and direct fan monetisation work better together than either does alone.
| Platform benchmark | Streams with ≈ $5 gross recording value |
|---|---|
| Spotify — $3.00 / 1K | 1,667 |
| YouTube — $4.80 / 1K | 1,042 |
| Apple Music — $6.20 / 1K | 807 |
| Amazon Music — $8.80 / 1K | 569 |
Make the track ready.
Make the ownership clear.
Use BTR’s free music tools to prepare the audio, then document who owns what before the release leaves your hands.
What this calculator
does—and does not
claim.
The goal is a defensible planning tool. Every benchmark is dated and scoped so an estimate cannot quietly turn into a promise.
Calculation method
- Gross platform estimate: eligible streams ÷ 1,000 × entered dollars per 1,000 streams.
- Estimated amount after entered deductions: gross estimate × master ownership percentage × (1 − entered service fee percentage).
- Reverse calculation: target net income ÷ effective retained share ÷ entered rate × 1,000, rounded up to the next whole stream.
- Default cross-platform figures are Duetti’s observations for Spotify, Apple Music, Amazon Music and YouTube during 2024, published 23 January 2025.
- The calculator uses US dollars. It does not perform live currency conversion.
- It does not add publishing royalties, flat distribution charges, recoupment, advances, tax, withholding, bank fees or withdrawal minimums.
- It does not determine whether a play is royalty-eligible or valid under a platform’s rules.
Primary and research sources
- Duetti 2024 Music Economics Report announcement — comparable observed master-owner benchmarks.
- Spotify Loud & Clear FAQ — streamshare, payout flow and 2025 industry totals.
- Spotify track monetization eligibility — 1,000-stream threshold and unique-listener condition.
- Apple Music Insights: Royalties — label headline rate and the scope of Apple’s 2020 one-cent average.
- YouTube’s $8 billion music-industry payout announcement — current scale and revenue model.
- Qobuz’s audited average disclosure — $18.73 per 1,000 and its labels-plus-publishers scope.
- Deezer and Sacem artist-centric announcement — allocation-model context.
For BTR’s first-party view of what independent discovery looks like before a royalty calculation begins, read the Independent Music Streaming Statistics 2026 report, based on 26,743 tracks, 5,285 artists and 25.8 million recorded platform plays.
Music streaming
royalties FAQ.
How much do 1 million music streams pay?
Using the comparable historical benchmarks in this calculator, 1 million streams produces a gross recording-rights estimate of about $3,000 on Spotify, $4,800 on YouTube, $6,200 on Apple Music or $8,800 on Amazon Music. These are planning estimates before ownership splits, fees, recoupment and tax—not guaranteed platform rates.
Which music streaming platform pays artists the most?
Among the four services in Duetti’s comparable 2024 master-owner dataset, Amazon Music had the highest observed amount at $8.80 per 1,000 streams. Qobuz separately disclosed $18.73 per 1,000 for royalties due to labels and publishers, but that scope is not directly comparable. A higher observed average also does not guarantee higher total income because audience size and stream volume differ.
How many Spotify streams are needed to make $1,000?
At the calculator’s $3.00 per 1,000 default, approximately 333,334 eligible Spotify streams would produce a $1,000 gross recording-rights estimate. Using the broader $3–$5 per 1,000 planning band in BTR’s Spotify-specific guide, the range is roughly 200,000 to 333,334 streams before deductions.
Does Spotify pay a fixed amount per stream?
No. Spotify says it pays rights holders through streamshare, not a fixed per-stream tariff. The effective amount commonly described as “pay per stream” is calculated after the fact and changes with revenue, total eligible streams, market, plan mix and rights agreements.
Does Apple Music pay one cent per stream?
Apple reported an average of $0.01 per play for individual paid plans in 2020. Apple’s own note says the value varied by plan and territory and included label and publisher royalties. It is not a guaranteed current artist take-home rate.
Do Spotify tracks under 1,000 annual streams earn recording royalties?
Spotify says a track must have at least 1,000 streams during the previous 12 months and meet an undisclosed unique-listener threshold to enter its recorded-music royalty pool. Spotify states that this policy does not change publishing-royalty calculations.
Does this calculator include publishing royalties?
No. The default rates estimate recording or master-side revenue. Songwriters and composers may also earn performance and mechanical royalties from the composition, but those payments use separate collection routes and are not added here.
Why was my actual streaming payout lower than the calculator?
Your listener markets, subscription and advertising mix, platform eligibility, master ownership, collaborator splits, distributor or label terms, recoupment, taxes, currency conversion and fees can all reduce or change the final amount. Compare the calculator with a statement covering the same platform, rights type and accounting period.
How do I calculate my real effective rate from a royalty statement?
For one platform and accounting period, divide the relevant recording revenue by the matching eligible streams, then multiply by 1,000. For example, $420 of master revenue divided by 100,000 eligible streams and multiplied by 1,000 equals an effective $4.20 per 1,000 streams for that statement.
Should independent artists focus only on the highest-paying platform?
No. Total artist income depends on both value per stream and the volume and quality of the audience an artist can reach. Discovery, repeat listening, rights ownership, fan conversion and direct revenue can matter more than the highest headline average.